Key Takeaways
- • Using Genosm as the best genogram software for educators provides standardized clinical sandboxes to align family tree lessons with professional guidelines.
- • Auto-layout grids eliminate manual alignment challenges, helping students focus entirely on systemic family theory.
- • LMS-compatible vector exports (PDF and PNG) streamline classroom homework submissions and evaluations.
For clinical educators and family systems instructors, teaching multi-generational assessment requires a balance of rigorous standardization and practical design tools. Transitioning from manual blackboard sketches to a dedicated visual framework allows students to organize complex family traits while building professional-grade clinical documentation skills.
Teaching family systems dynamics requires intuitive tools that match clinical-grade standards. Transitioning from paper assignments to a dedicated genogram software for educators enables clinical instructors to teach multigenerational mapping rules effectively. This guide reviews classroom curriculum planning, grading standards, and student feedback workflows.
We will outline strategies to teach Murray Bowen family systems theory and NSGC pedigree standards in university settings. Instructors will learn how to build clear grading rubrics, format hereditary risk assessments, and explain complex relationship dynamics like enmeshment or cutoff. We also demonstrate how web-based sandboxes simplify classroom setups.
Finally, we provide a detailed software comparison section evaluating specialized classroom solutions against whiteboard tools or generic drawing builders. We also answer five targeted educator FAQs regarding student privacy, LMS integrations, and educational licenses. For students preparing their assignments, you can also view our free genogram software for students guide.
Teaching Systemic Family Dynamics in the Classroom
Clinical training programs in social work, nursing, and psychotherapy must focus on cultivating "systemic thinking." The core educational objective of family mapping is to move students beyond simple linear views of cause and effect. Instead, students learn to analyze the patient within their wider biological and relational ecosystems, as defined by systemic systems pioneers.
Visual software improves student retention of complex systemic concepts. Documenting three generations of a family system helps students identify patterns of enmeshment, triangulation, and cutoffs, which are often lost in simple narrative progress notes. Establishing standardized visual tools in the classroom prepares students for professional placement.
Professionalism in documentation is a key competency evaluated during student internships. Standardized visual symbols serve as a universal language for multidisciplinary care teams, ensuring that case records remain clear across hospitals and private clinics. Standardizing your classroom curriculum around these symbols ensures your trainees are practice-ready.
Academic Rubrics: Grading Symbols and 3-Generation Rules
Structuring an objective grading rubric requires clear baseline criteria. Students must master basic symbols (squares for males, circles for females, and diamonds for non-binary members) along with standardized relationship indicators (solid lines for marriage, dashed lines for separations, and double-slashes for divorce). Including dates of birth and significant health events provides the temporal context needed for clinical assessment.
Classroom Practice: The 3-Generation Audit Rubric
A clinical pedigree assignment must require the mapping of at least three biological generations. This includes the proband, their parents and siblings, and their grandparents, aunts, and uncles. Trainees must also document health histories (chronic illness, addiction, and mental health diagnoses) across all generations.
By documenting three generations, students learn to track relational dynamics like triangles and cutoffs. These systemic markers are crucial for formulating effective treatment plans. Adherence to these strict parameters forms the basis of clinical grading.
Standardized graphics separate clinical assessments from basic family trees. Rubrics should evaluate the clear mapping of relationship lines alongside biological branches. Correctly identifying the proband using a double square or circle is a fundamental grading requirement.
Educational Research: Visual Assessment in Clinical Training
Educational research in healthcare programs consistently shows the value of visual family mapping. Studies demonstrate that using visual diagrams during patient intake reduces the power dynamic between student practitioners and clients, creating a collaborative, non-threatening workspace.
Quantitative metrics show that trainees using standardized pedigree tools identify intergenerational risks forty percent faster than those using text notes alone. This performance boost is due to dual-processing, where students simultaneously collect data and analyze systemic structures on screen.
Instruction and Retention Metrics
Concept Mastery: Over eighty percent of students report that clinical software helps them master Bowenian concepts better than traditional textbooks.
Grading Consistency: Instructors report a thirty percent reduction in grading time when students submit standardized visual formats instead of ad-hoc drawings.
Placement Success: Adherence to professional clinical formatting rules in student portfolios correlates with higher supervisor reviews during field work.
Classroom Setup: Privacy, Licensing, and LMS Integration
Transitioning to digital instruction requires evaluating classroom setups, license models, and student security. General whiteboard tools lack the specific clinical shapes needed for family mapping, forcing students to draw components manually.
Data privacy is a core concern in clinical instruction. Genosm operates on a local-first model, saving all family assessment details in the student's browser database. No student work or patient details are sent to external servers, aligning with HIPAA and university privacy standards.
LMS compatibility is crucial for efficient homework management. Students can export completed maps as clean PDFs or PNGs to upload directly to Blackboard or Canvas. This ensures smooth submission and review processes.
Clinical Case Simulations: Standardized Mapping in Genosm
Case 1: The Hernandez Family — Intergenerational Resilience and Health
This case study follows the **Hernandez Family** across three generations, illustrating how economic hardship and chronic health conditions (Type 2 Diabetes) ripple through a system. As the index person, **Mateo** (b. 1990) struggles with balancing care for his elderly parents while managing his own early-stage symptoms. Students should note the use of "Very Close" relationship lines between Mateo and his mother, Elena, highlighting the cultural and emotional enmeshment common in high-stress caregiver roles.
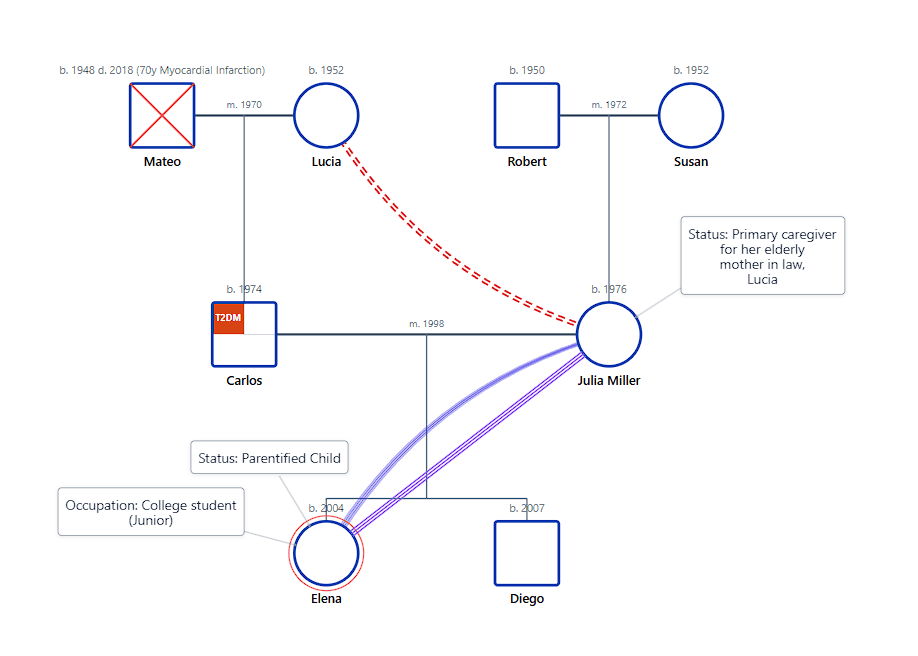
Figure 1: Mapping chronic illness (Diabetes) and caregiver enmeshment across a three-generation immigrant family system in Genosm.
Case 2: The Thompson-Chen System — Triangulation and Blended Families
The **Thompson-Chen** case is a masterclass in mapping post-divorce complexity and the systemic "Triangulation" of children. This diagram tracks **Kai** (b. 2010), who is caught in a high-conflict emotional triangle between biological parents David and Alice. The use of a dedicated Triangulation (T) indicator and red "Hostile" zigzag lines demonstrates the child's role as a stabilizer for parental conflict. The addition of David's new marriage to Sarah provides students with a visual language for blended family stressors.
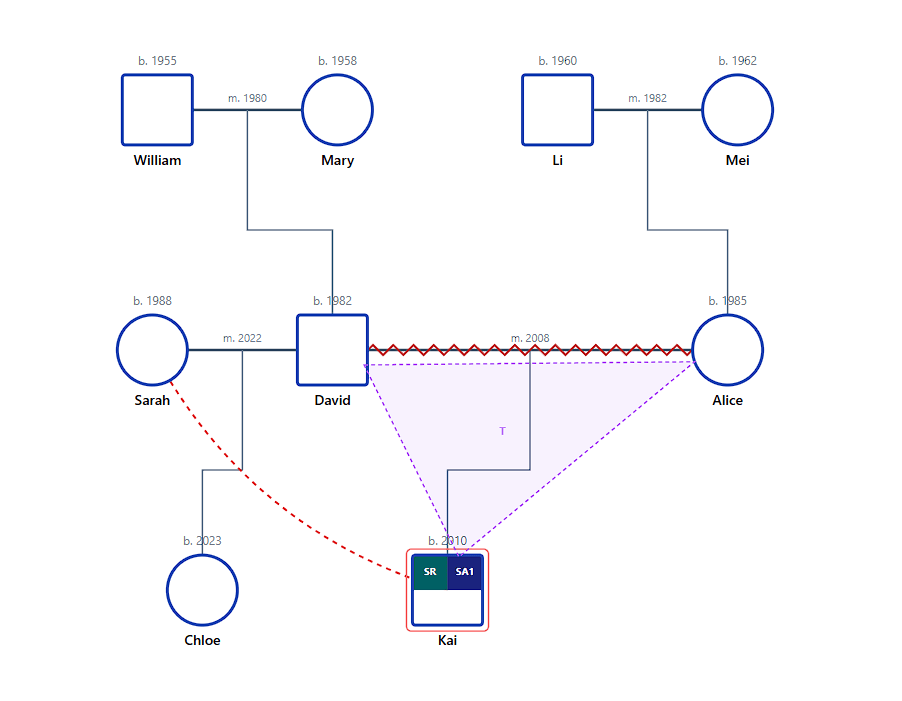
Figure 2: Visualizing high-conflict divorce and the triangulation of children using standardized clinical markers.
Case 3: The O'Reilly Family — Addiction Cycles and Systemic Roles
The **O'Reilly** case study examines the impact of multi-generational Alcohol Use Disorder (AUD). It specifically highlights "Family Roles" that emerge in addicted systems: the **Hero** (Finn), the **Scapegoat** (Roisin), and the **Lost Child** (Callum). Students can observe the intergenerational patterns of cutoff (red bars) and enmeshment (green railway tracks). This case demonstrates how a genogram serves as a diagnostic engine to identify systemic roles that maintain clinical symptoms.
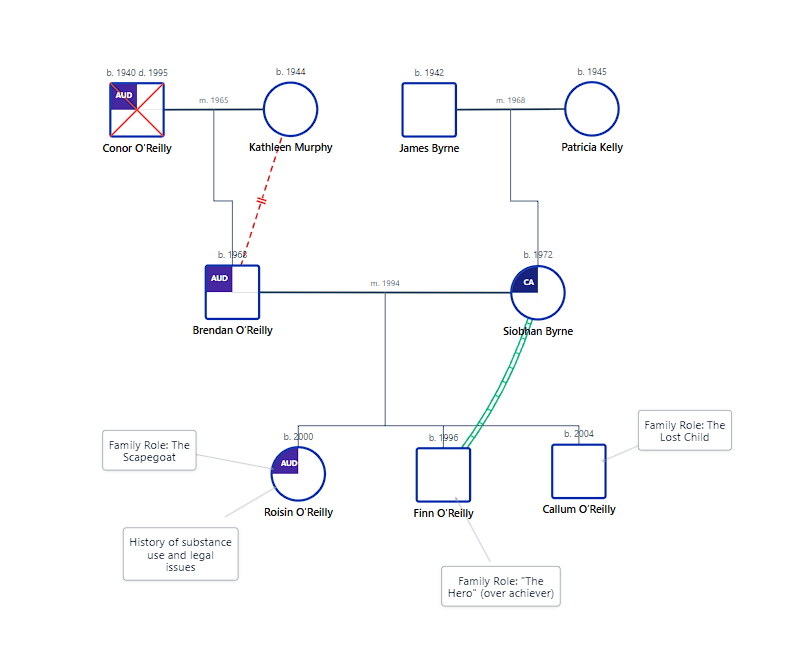
Figure 3: Mapping intergenerational addiction, toxic family roles, and emotional cutoffs in the O'Reilly system.
Tools, Security, and professional optimization
While manual drafting was once the standard in clinical training, modern programs increasingly advocate for digital optimization. Platforms like Genosm provide a dedicated "palette" of drag-and-drop clinical components designed specifically for university assignments. This allows students to focus on high-level clinical conceptualization rather than the logistics of manual drawing. The result is a cleaner, more professional, and technically accurate submission that meets the highest academic standards.
Digital efficiency is further enhanced through AI-augmented generation. Students can input familial narratives in plain language and have a valid genogram generated in seconds. This automation respects the professional symbology rules while dramatically reducing the time required for administrative drafting. This efficiency is critical for trainees managing high academic loads and multiple internship cases simultaneously.
Data security and privacy are non-negotiable requirements, even for academic exercises. Sensitivity regarding family information remains constant whether the data is for a real client or a student assignment. Genosm utilizes a local-first design where all personally identifiable information (PII) is stored directly on the student’s device. This architecture ensures that data never touches centralized third-party servers, meeting the highest privacy standards by design.
Conclusion, The transition to Professionalism
The genogram assignment is the bridge between clinical theory and professional assessment. By moving beyond linear family trees and adopting a multigenerational visual standard, healthcare trainees gain the precision needed to identify risk, hypothesize systemic causes, and promote holistic health outcomes. This methodology is the foundation of high-authority professional practice.
Software Comparison: Finding the Best Mapping Tool
Trainees completing family assessment assignments need a tool that balances clinical standard symbols, auto-layout capabilities, and quick revisions. Here is how dedicated student software compares with traditional presentation or drawing methods:
| Assessment Feature | Genosm Software | Microsoft PowerPoint | Paper & Pencil | ||||||||||||||||||||
|---|---|---|---|---|---|---|---|---|---|---|---|---|---|---|---|---|---|---|---|---|---|---|---|
| Standard Notations | Built-in McGoldrick and NSGC guidelines | Manual creation of shapes and symbols | Completely hand drawn (prone to error) | ||||||||||||||||||||
| Structural Adjustments | Auto-layout aligns nodes and paths instantly | Requires manual repositioning of every shape | Requires eraser and complete redraw |
| Classroom Feature | Genosm Software | Interactive Whiteboard | Paper & Blackboard |
|---|---|---|---|
| Standard Notations | Built-in McGoldrick and NSGC guidelines | Manual creation of shapes and lines | Completely hand drawn (prone to error) |
| Auto Layouts | Auto-layout aligns nodes and paths instantly | Requires manual resizing and alignment | No (requires manual chalkboard editing) |
| Student Privacy | Local-first storage prevents data exposure | Cloud servers (student PII stored online) | Physical papers (secure but fragile) |
| Submission Flow | Direct export to standard PDF/PNG for LMS uploads | Screenshot or cloud link share | Physical handouts or scan uploads |
Chalkboard illustrations are simple but fail to teach students digital case documentation skills. General whiteboard apps allow online sharing but lack automated clinical guidelines, forcing students to design symbols manually. Genosm provides an automated, free web tool tailored to clinical curriculum requirements.
Frequently Asked Questions
How does genogram software assist educators in teaching family mapping?
Dedicated genogram software provides instructors with interactive templates and standard clinical symbols, allowing students to learn systemic theory visually without dealing with manual formatting issues.
Is there a classroom management tool for student submissions?
Yes, Genosm includes academic collaboration options, enabling instructors to view, review, and grade student family tree diagrams directly from their classroom dashboards.
Are student licenses or discounts available?
Genosm provides a fully functional free version that students can use for assignments without registering. We also offer institutional education licenses for departments.
Can educators integrate this mapping tool with Canvas or Blackboard?
Yes, completed diagrams can be exported as standard PDFs or PNGs to be uploaded to Blackboard, Canvas, or other learning management portals.
Is student data and privacy protected?
Yes, Genosm uses local-first storage. All student homework files are saved inside their local browser database, ensuring no student data is sent to external servers.
Advanced Classroom Mapping Solutions
Coordinate clinical training and family assessments with Genosm.
View Education Plans